 Download catalog
 Technical support
 Check your order
 Tiếng Việt
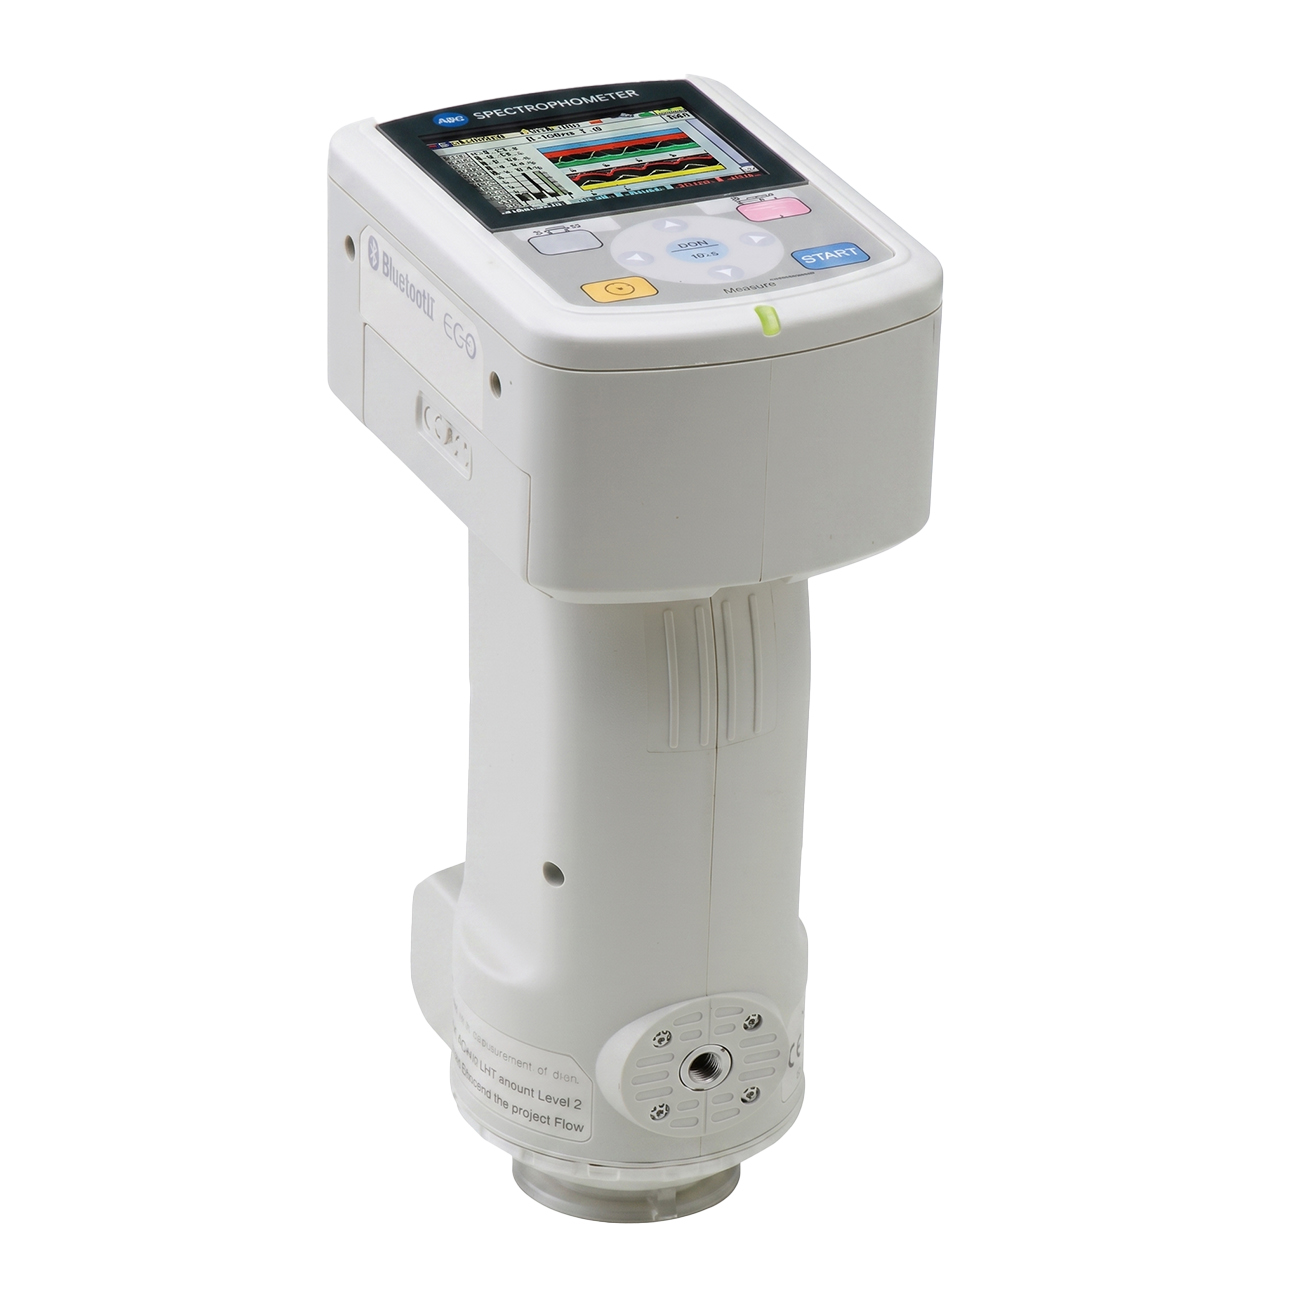
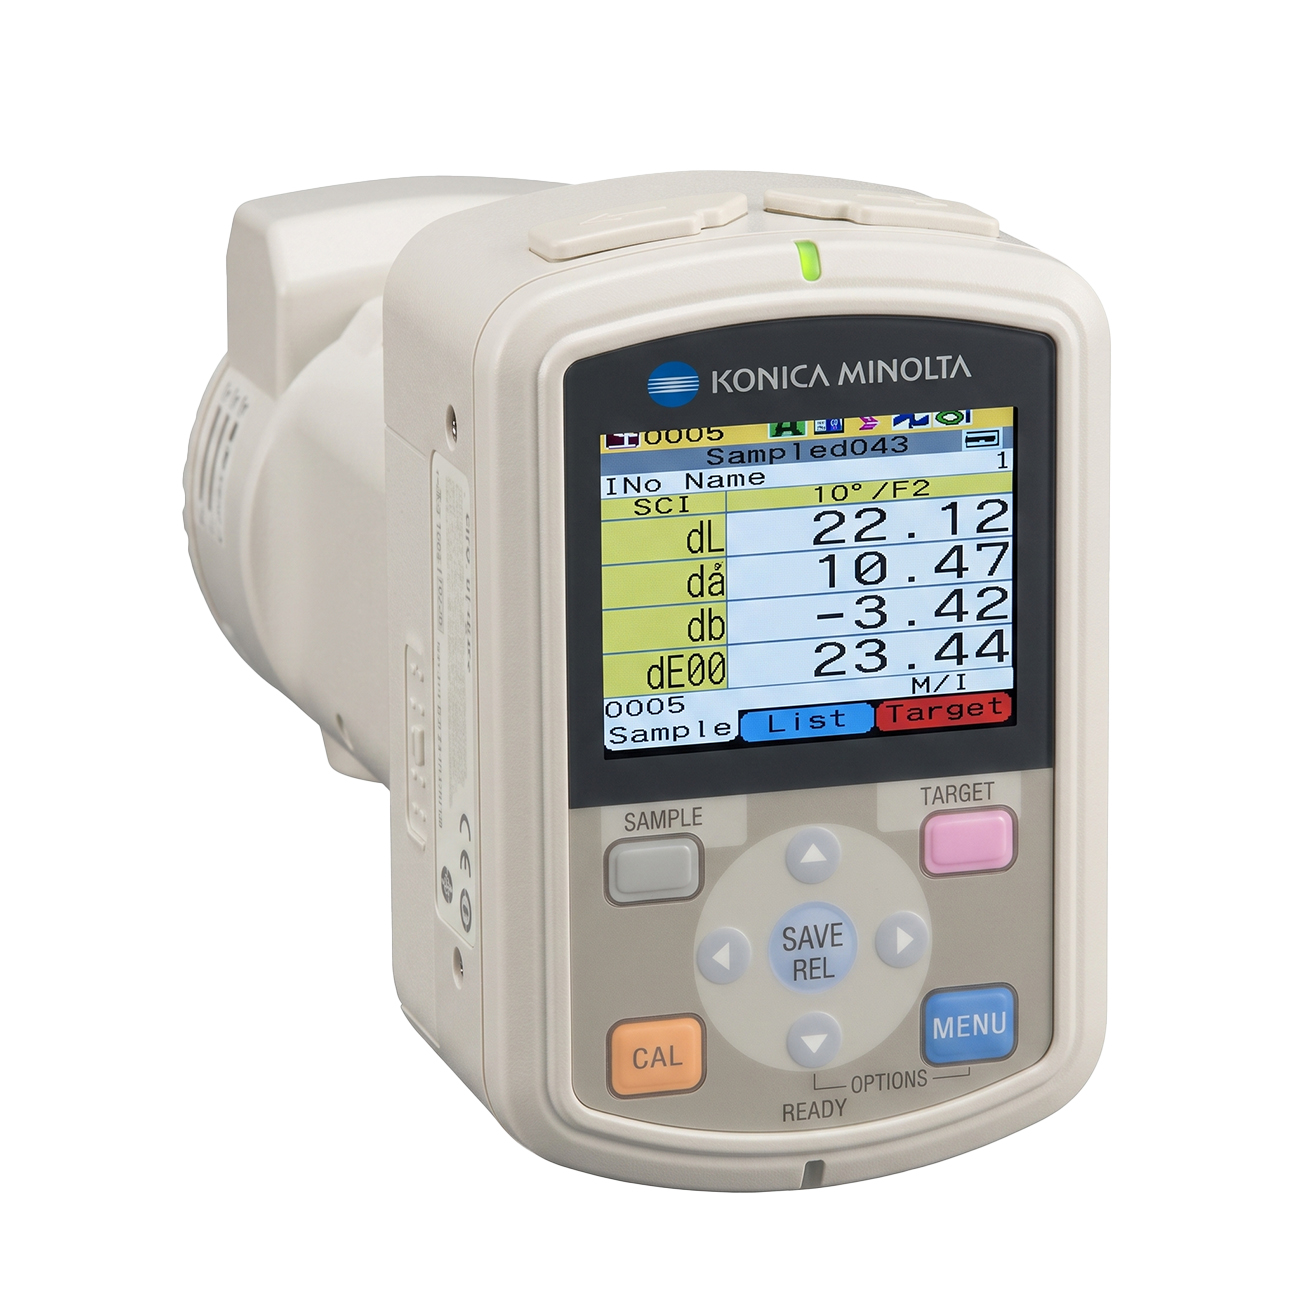
Konica Minolta CM-700d Spectrophotometer
Contact
SKU: CM-700d
Warranty: 12 Months
Origin: Japan




Product Details
Konica Minolta CM-700d Spectrophotometer
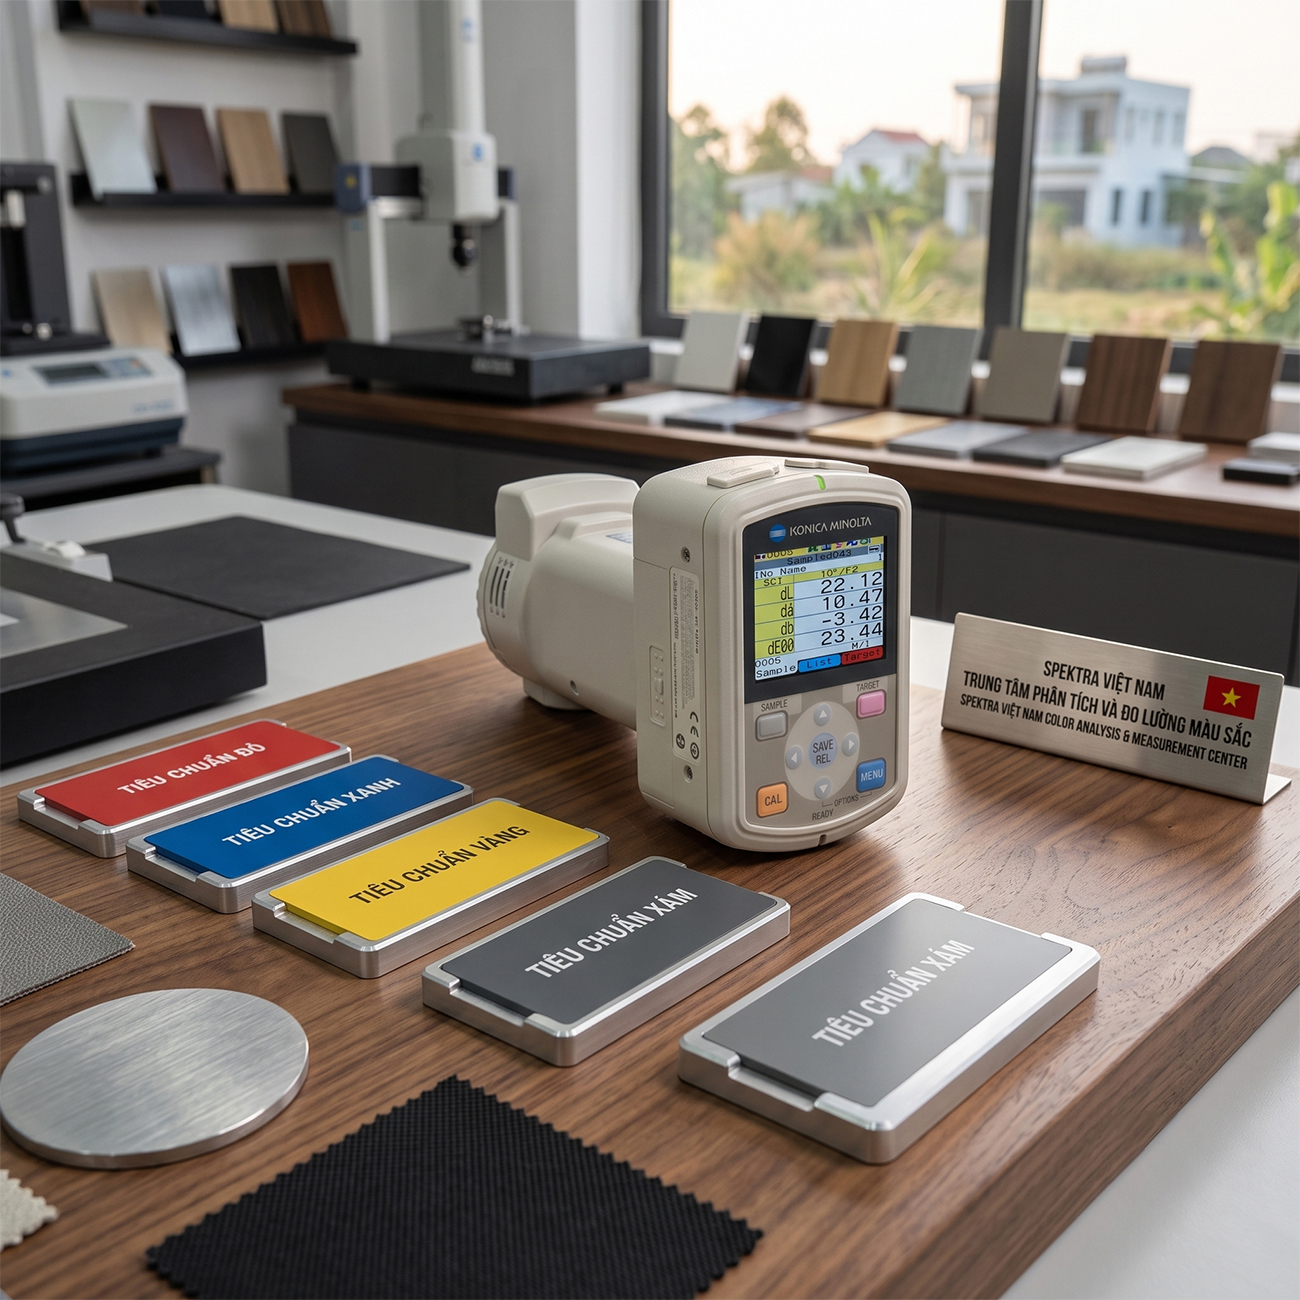
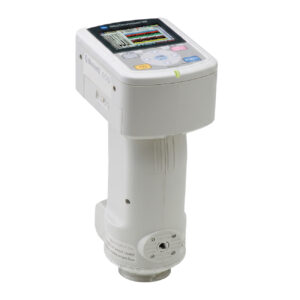
The Konica Minolta CM-700d spectrophotometer, equipped with user-friendly features, guarantees highly accurate color measurement of objects. Its ergonomic design is optimized for comfortable handling, featuring a sharp, high-contrast color LCD screen. Comprehensive data such as spectral graphs, pseudo-color display, and color-difference graphs are clearly rendered on the display.
This instrument also enables color emulation directly on the display screen, which is exceptionally convenient for evaluating color matches or verifying color accuracy. Dedicated buttons are integrated for frequently accessed functions, such as entering menus or selecting target colors, significantly improving the instrument’s ease of use. An on-screen operation guidance interface makes handling highly intuitive.
The device supports Bluetooth wireless connectivity and offers high portability, enabling wireless data transmission to compatible printers or computers. Equipped with a massive internal memory capacity, it can store up to 1,000 target data sets (standards) and 4,000 sample data sets.
Key Features of Konica Minolta CM-700d
- Switchable Apertures – MAV: Ø8 mm measurement / Ø11 mm illumination, SAV: Ø3 mm measurement / Ø6 mm illumination.
- Compact and Lightweight Design – highly portable.
- Ergonomically Optimized – comfortable handling and effortless alignment positioning.
- Bluetooth Supported – wireless data transmission or via USB connection to PCs or printers.
- Massive Memory Capacity – stores extensive target standards and routine measurement data.
- Simultaneous SCI and SCE Automated Switching.
- Easy Operation – dedicated standalone buttons for commonly used functions.
- Multi-Color LCD Display – renders extensive diagnostic data including pseudo-color and spectral reflectance graphs.
- Optional Color Data Software – enables comprehensive data viewing, profile editing, and report printing.
Measurement Result Display Modes of Konica Minolta CM-700d
The Konica Minolta CM-700d spectrophotometer can display measurement results across a wide variety of color spaces, such as L*a*b*, Hunter Lab, Yxy, XYZ, and Munsell. It also provides standard industrial color indices including Whiteness Index (WI), ISO Brightness, Yellowness Index (YI), and notably the Metamerism Index (MI). The instrument is capable of calculating advanced color difference equations utilized in modern workflows, including Delta E ($\Delta E^*ab$), Delta E 94 ($\Delta E^*94$), and Delta E 00 ($\Delta E_{00}$).
The standard Delta E ($\Delta E^*ab$) color difference formula is currently the most widely deployed assessment metric. However, calculating color variation using this traditional formula exhibits certain limitations. The drawback of this specific equation is that certain color specimens can present a very low numerical Delta E value, yet still show a highly noticeable visual difference when inspected by the human eye.
Consequently, using this standard color difference formula alone for quality grading can lead to situations where numerical acceptance thresholds fail to align with actual human visual perception.
To eliminate these discrepancies, the International Commission on Illumination (CIE) refined these optical equations, introducing Delta E 94 and Delta E 00 as the newest standard formulas. These two optimized equations effectively minimize the structural limitations inherent in the legacy Delta E (1976) formula.
Understanding the Metamerism Index (MI): Why choose a CM-700d spectrophotometer instead of a standard filter-based colorimeter?
The reason is simple: a true spectrophotometer provides highly precise spectral sampling, capturing data at exact 10nm wavelength intervals. The displayed colorimetric results are computed directly from the visible spectrum range of 400–700nm. Sampling at a 10nm pitch delivers exceptionally stable and precise color evaluations.
More importantly, a spectrophotometer series can calculate and display the Metamerism Index (MI). This metric is critical because it reveals metameric phenomena—where two samples match under one light source but differ under another—which standard filter-based colorimeters are fundamentally incapable of detecting.
Data Rendering Formats of the CM-700d
The Konica Minolta CM-700d enables measurement results to be rendered across multiple color spaces including Lab*, Hunter Lab, Yxy, XYZ, and Munsell. It provides standard industrial color indices such as Whiteness Index, ISO Brightness, Yellowness Index, and particularly MI. Concurrently, the device evaluates color variations using advanced equations such as Delta E, Delta E 94, and Delta E 00.
Among the colorimetric evaluation methods, Delta E is the most widely deployed. However, this classical method has limitations; for instance, certain specimens exhibit a low Delta E discrepancy numerically but reveal clear, distinct color mismatches when subjected to physical human visual inspection. This mismatch prompted the CIE to formulate advanced equations like Delta E 94 and Delta E 00 to overcome the limitations of standard Delta E.
The CM-700d excels at calculating the Metamerism Index, which flags specimens that match visually under a single specific illuminant but differ spectrally. This capability represents a significant advantage over lower-end filter-based colorimeters. A true spectrophotometer like the CM-700d executes precise spectral analysis, taking samples at 10nm intervals across the visible light spectrum from 400–700nm. This provides highly reliable data logging while calculating the critical MI values that standard colorimeters cannot resolve.
Reviews (0)
No comments yet
Related products





- SKU: NH310+
- Origin: China
- Warranty: 12 Months
Bạn vui lòng nhập đúng số điện thoại để chúng tôi sẽ gọi xác nhận đơn hàng trước khi giao hàng. Xin cảm ơn!
There are no reviews yet.